How to create visualizations for Power BI
Power BI helps analyze and create visuals for table data. The data can come from Excel, Access, Online, etc. When importing table data from any source, it’s possible to sort, filter, and transform the data in anyway you need. However, you may prefer to transform the data prior to importing to make the process faster and easier in Power BI. Here’s how you can do it…
Open Power BI Desktop and maximize the main window:
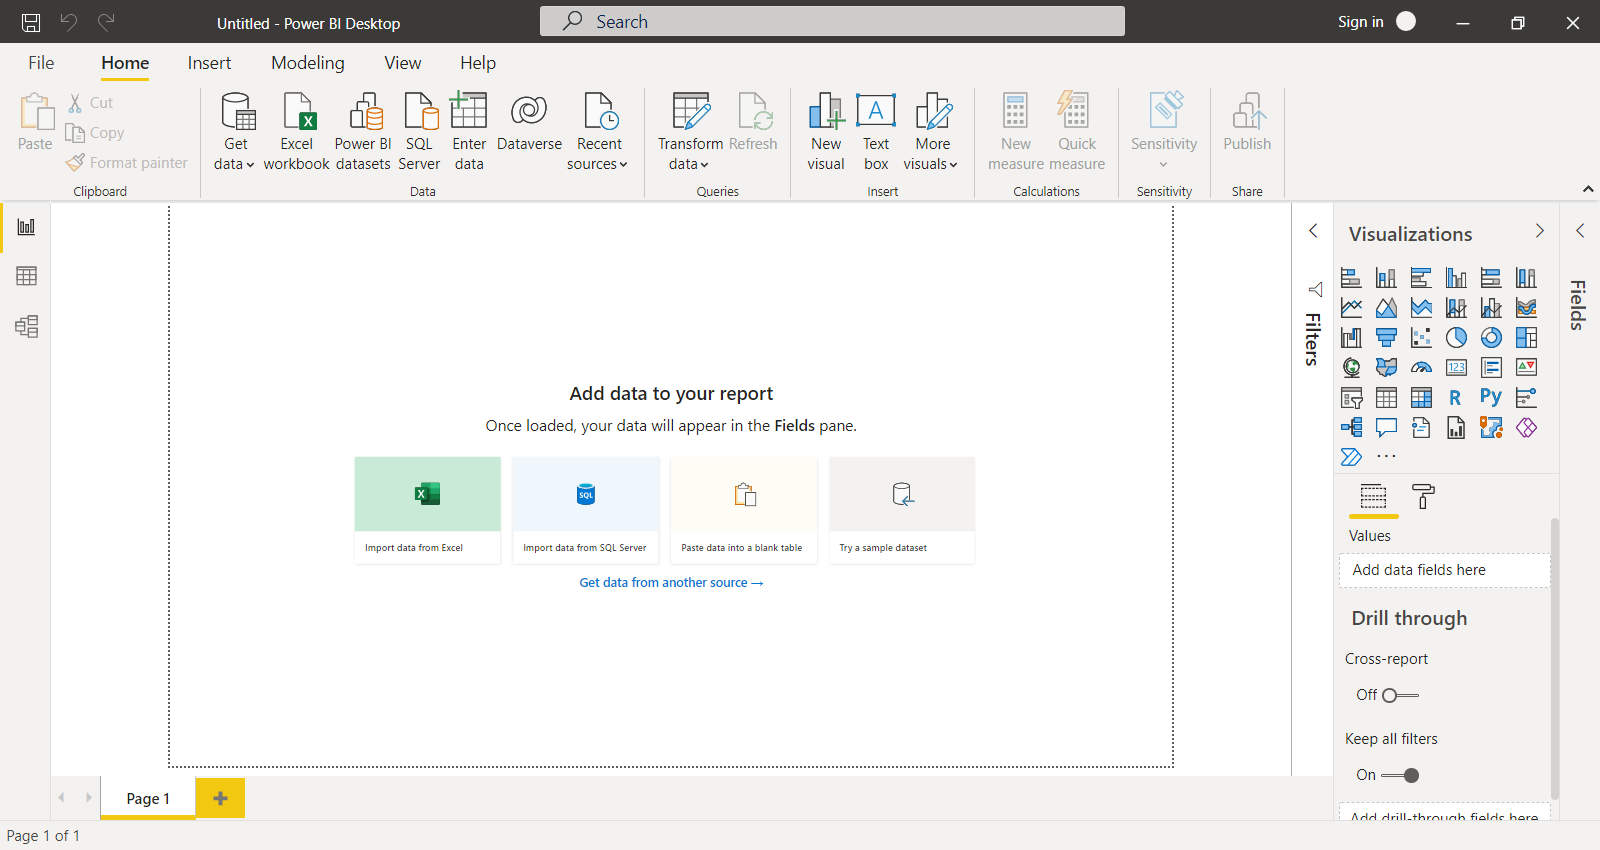
On the Ribbon, select Transform Data:

The Power Query Editor window opens and you would then select “New Source” at the top-left:

You can connect to any type of table data source you have. Once the next window opens, you can choose which table you want to import and it will load the data into Power Query Editor:
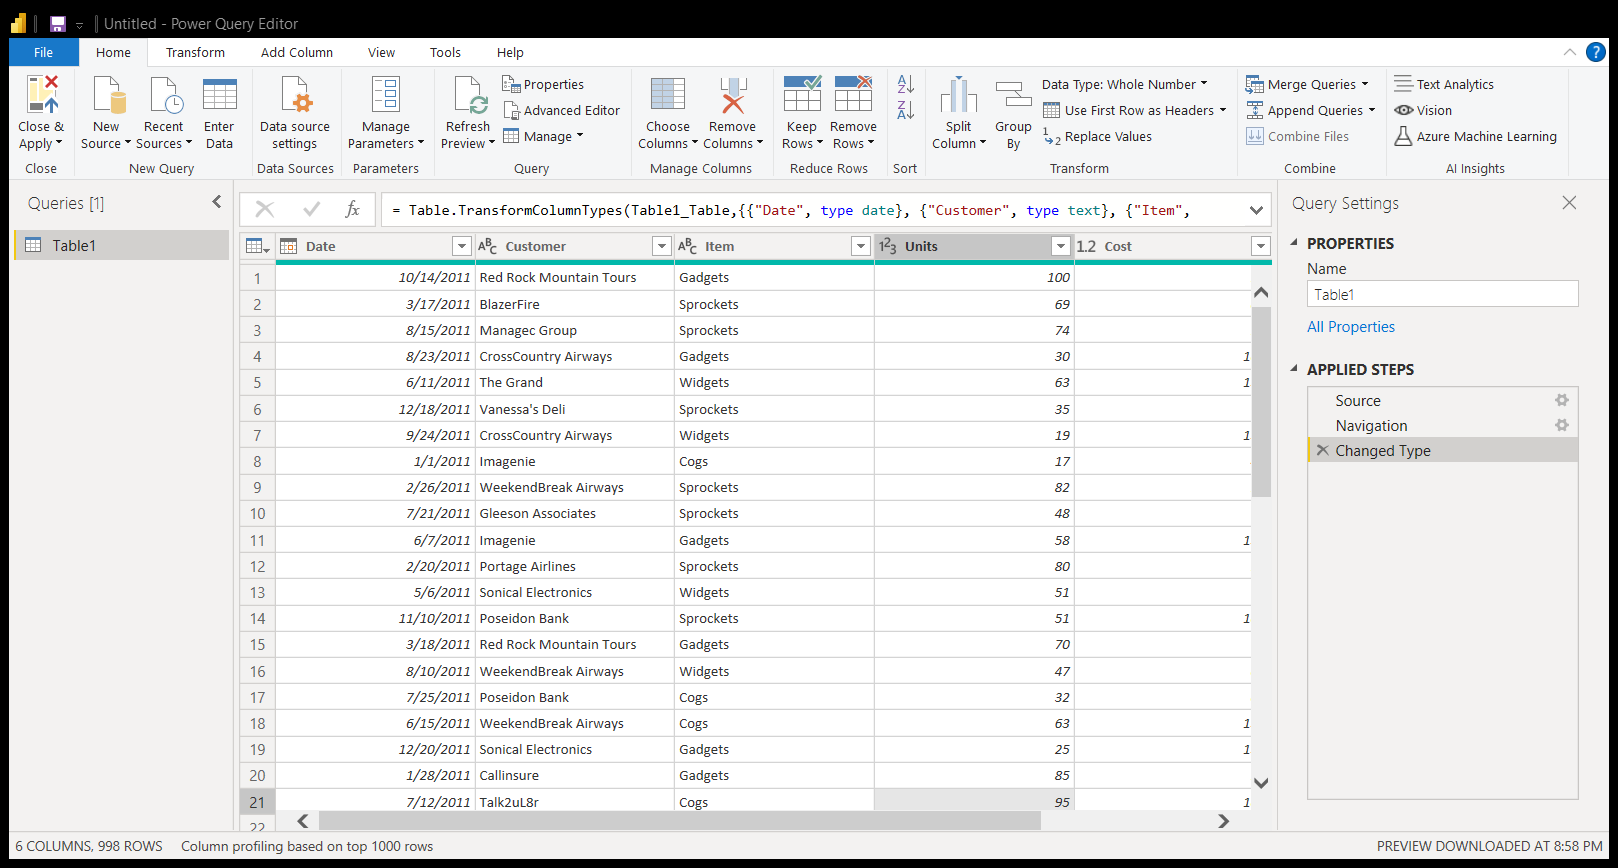
From this window, you can sort, filter, and transform the data any way you see fit before it is imported into Power BI. Once you transform the data to your liking, you would select “Close and Apply” at the top-left to close Power Query and load the data:

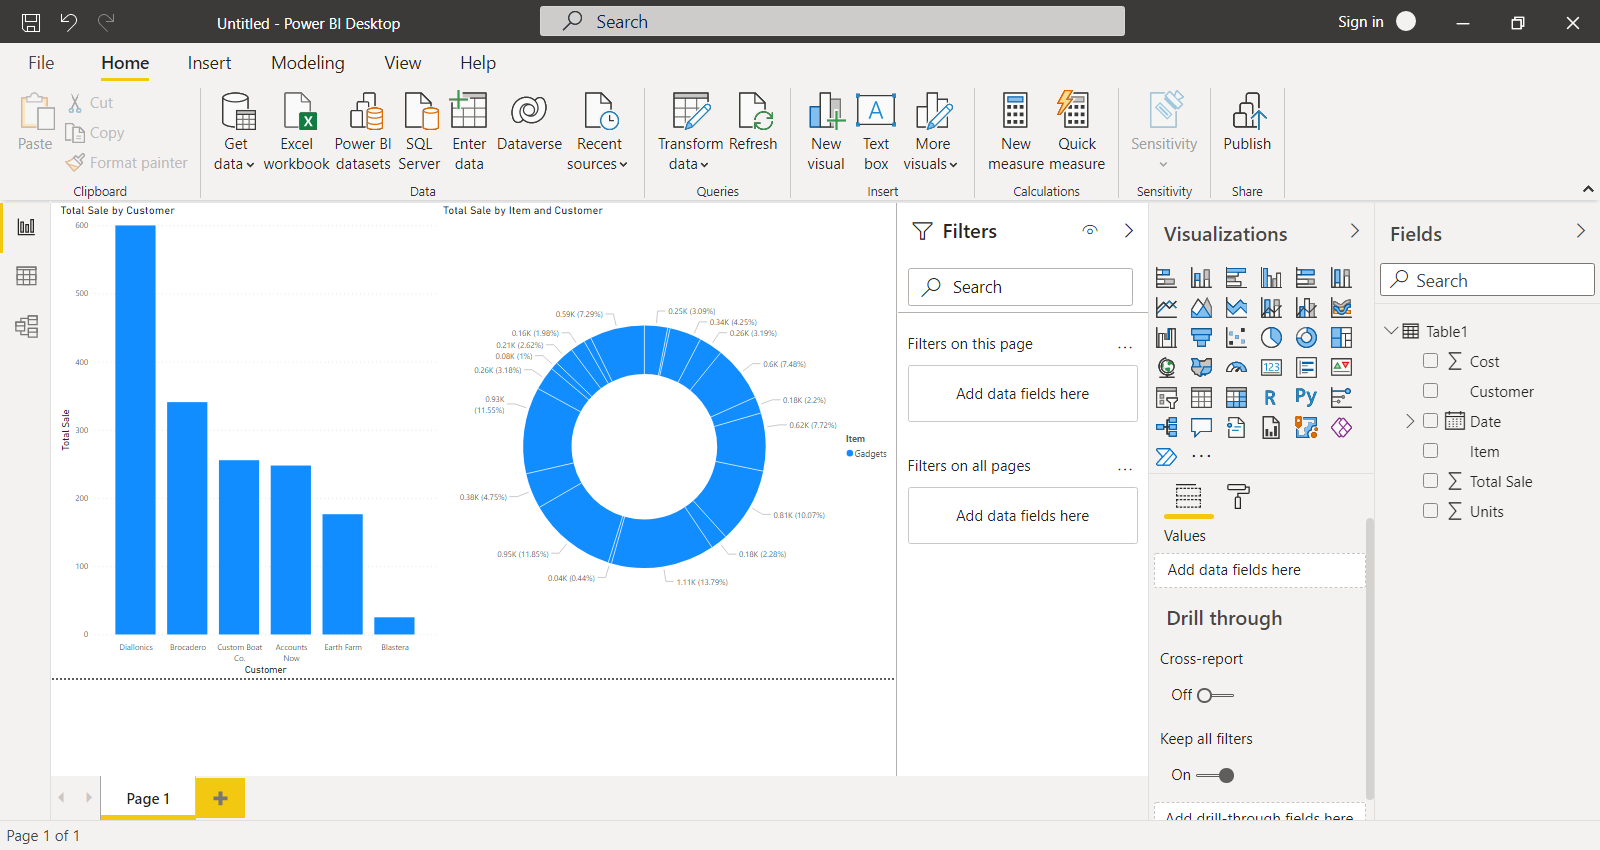
After the data is loaded, you can select the fields on the right and add them into the canvas to create the visualizations without having to filter or transform the data in Power BI Desktop.